Looker Studio (Google Data Studio)

Data Visualization,

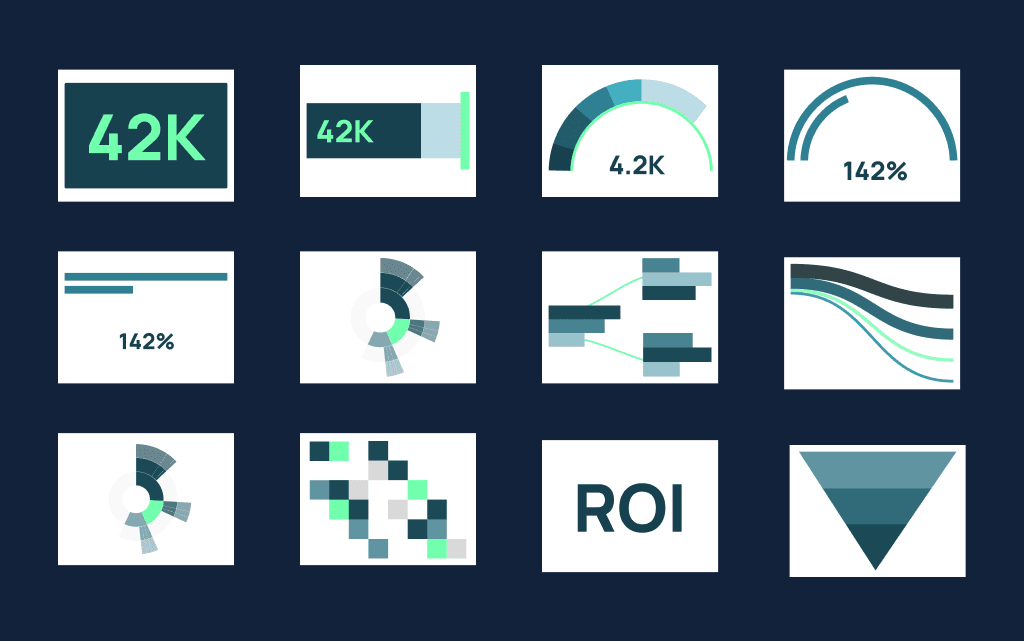
Turning data into visuals using suitable graphs and charts is a great way to monitor your campaign performance and communicate the results with different stakeholders. In this article, we’ll show you step-by-step how to build an actionable dashboard using one of the most popular data visualization tools among marketers—Looker Studio. Navigate this post: Navigating Looker ...

12-MINUTE READ | By Kathy Murillo & Isha Shinde

Using Looker Studio (formerly Google Data Studio) is an easy way to connect your cross-channel data sources and visualize your performance. In this blog post, we share 10 must-know Looker Studio tips for marketers to help you create better and more efficient dashboards.  If you prefer to see these tips in action, check out the ...

15-MINUTE READ | By Fanny Heimonen & Ralph Spandl & Milja Nevalainen

A featured image that depicts Supermetrics' best free charts.

Let’s be real: simple bar graphs and pie charts have become stale. If you want more striking, detailed, and — best of all — free ways to communicate your insights and visualize your data, you need to check out these bold alternatives for Looker Studio. Community visualizations have become a substantial part of Looker Studio ...

6-MINUTE READ | By Ralph Spandl

Tile grid maps and heatmaps are intuitive ways to visualize extremely specific data. In this article, we show what you can do with a tile grid map, explore the free version of the Supermetrics tile grid map in the Looker Studio community visualization gallery, and explain the difference between the light and the pro versions. ...

5-MINUTE READ | By Ralph Spandl

Tell Me, the latest addition to Supermetrics Charts, is designed with a core purpose in mind: to create simple and informative sentences that effortlessly guide readers through your dashboard. This article explores how Tell Me can help you transform your dashboards into clear and concise data narratives that resonate with all audiences. Skip ahead >> ...

7-MINUTE READ | By Ralph Spandl

Google Analytics 4 vs. Universal Analytics: what’s the difference

Universal Analytics (UA) will sunset on July 1, 2023. That means your UA properties will stop gathering new data. If your web analytics reports in Google Sheets or Looker Studio still use UA data, it’s time to update them with Google Analytics 4 data. This guide will show you how to update your reports effortlessly ...

10-MINUTE READ | By Mick Chaveroche

1

...

Explore the blog

Want to see what Supermetrics can do for you?

Get full access to Supermetrics with a 14-day free trial.

No credit card required.

Book Demo

Marketing Intelligence Cloud

  • Connect
  • Store
  • Transform
  • Analyze
  • Act

© Supermetrics 2024