Sep 22, 2020
Make your ecommerce data work harder with the brand new Shopify connector from Supermetrics
5-MINUTE READ | By Anna Shutko
[ Updated Jun 13, 2023 ]
Great news: you can now pull your Shopify data into Google Sheets, Google Data Studio, and Microsoft Excel with Supermetrics!
Why is this connector such a big deal?
Because it helps ecommerce merchants and marketers quickly understand what’s going on with the business.
As you’ve probably noticed, ecommerce data is scattered across multiple siloed platforms. You have your:
- …performance marketing data in Facebook, Instagram, Google, Taboola, Outbrain, Pinterest, and any other ad platform you happen to be using
- …session and conversion data in Google Analytics
- …order, customer, and product data in Shopify
With all these metrics hiding in their own platforms, it’s hard to decide where to focus your budget and efforts.
Supermetrics allows you to consolidate data from Shopify with data from your paid advertising channels, marketing automation platform, and web analytics tool to quickly understand what’s working — and what isn’t.
Keep reading to find out all the cool things you can do with the Shopify connector and grab a free, plug-and-play reporting template for Google Data Studio.
Make better decisions, uncover upsell opportunities, and monitor your inventory
With the help of Supermetrics, you can build reports with custom metrics in Google Sheets.
“The ability to create custom fields using any metric allows us to make better decisions faster. For example, being able to recreate First Time Impression Ratio to pull in as a column or creating Average Order Value as a column to look at trends across multiple campaigns at once,” explains Zach Stuck, founder & CEO of Homestead Studio.
Another good metric to monitor is how many days there are on average between a customer’s first, second, and third purchase. “We can then use this information for our cross-sell and upsell promotions,” Duane Brown, founder and Head of Strategy at Take Some Risk Inc, says.
Another superpower Supermetrics offers for Google Sheets is automatic data refresh and conditional emailing. Armed with this feature, you can create a rule that every time your product inventory drops below a certain threshold, an automatic email is sent either to you or directly to your supplier. This way, you’ll get the products you need on time and never run out of stock again.
Combine Shopify data with metrics from Google Analytics
“When you’re thinking about ecommerce marketing, think funnel,” says Irit Frank, the owner of Buzzz Communications, a specialized ecommerce agency.
And at Supermetrics, we couldn’t agree more. That’s because online shoppers rarely make a purchase on their first visit. Instead, they visit once, add something to cart, come back again, empty the cart, and in the end, they might even check out a completely different product than what they were originally looking for.
You can get a more detailed analysis of user behavior by pulling visit/session data from Google Analytics. Google Analytics and Shopify make a great pair as the former offers more traffic metrics as a part of Enhanced Ecommerce.
By analyzing your page copy together with ecommerce analytics data you’ll be able to answer the following questions:
- Is the product description clear to the visitor?
- Does the page inspire action?
- Who are my typical visitors and customers for each product?
After you’ve combined the data from these two sources, you’ll be able to see who your most typical customers are and what their buying behavior is like. This data can be used for optimizing your Shopify store’s conversion rate and your paid ad campaigns.
Calculate the ROAS of each channel with Shopify and paid ads data report
By combining your Shopify data with metrics from Google Ads, Facebook Ads, Twitter Ads, and other paid ad platforms, you’ll get a better understanding of the return on your ad spend.
“We use Shopify data in our client-facing reporting when talking about attribution. Being able to cross-reference directly attributed purchases and revenue from the different channels against what is reported in Shopify allows us to have a conversation with the client about the impact of each channel and plan accordingly,” says Zach Stuck, founder & CEO of Homestead Studio.
Here’s a dashboard Zach and his colleagues have created by combining data from Facebook Ads, Google Ads, and Shopify.
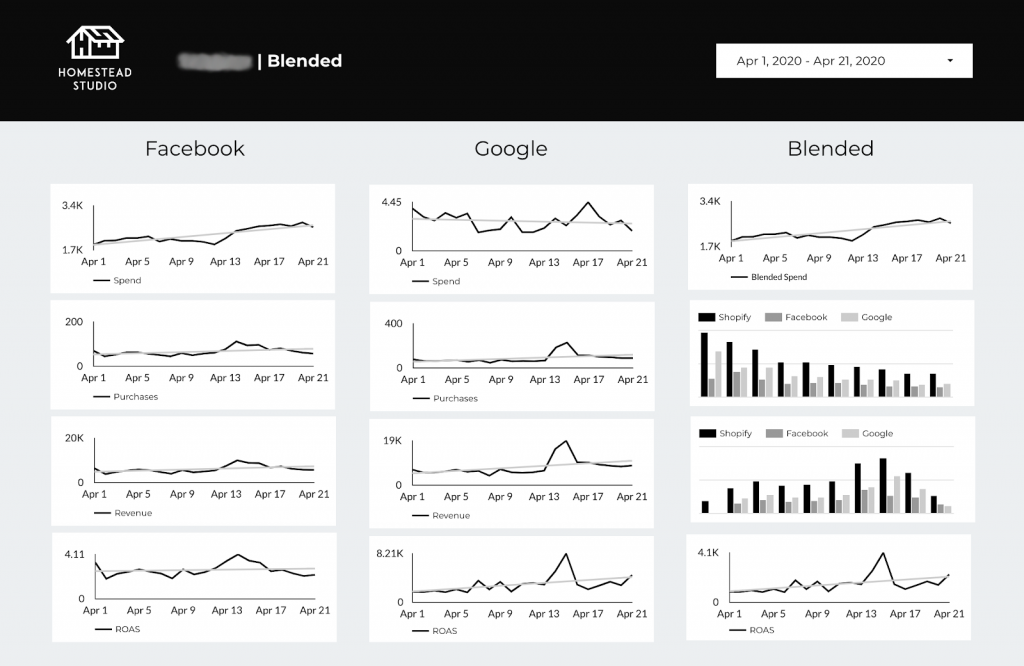
The blended column on the far right helps Zach and his team keep track of their total ad spend, purchases, revenue, and return on ad spend per client. The channel-specific data, on the other hand, is useful for comparing results when they’re running similar campaigns on both Facebook and Google.
Run product remarketing campaigns on Taboola or Outbrain
Data from Shopify can be used not only for awareness campaigns but also for remarketing. For example, you can run remarketing ads on Taboola and Outbrain featuring your best selling products.
With our Taboola and Outbrain connectors, you can easily report on both channels to come up with more ideas for remarketing campaigns.
Shopify reporting template for Google Data Studio
If you want to hit the ground running with Shopify reporting in Google Data Studio, we’ve got you covered — you can use our free, plug-and-play reporting template that consists of two pages:
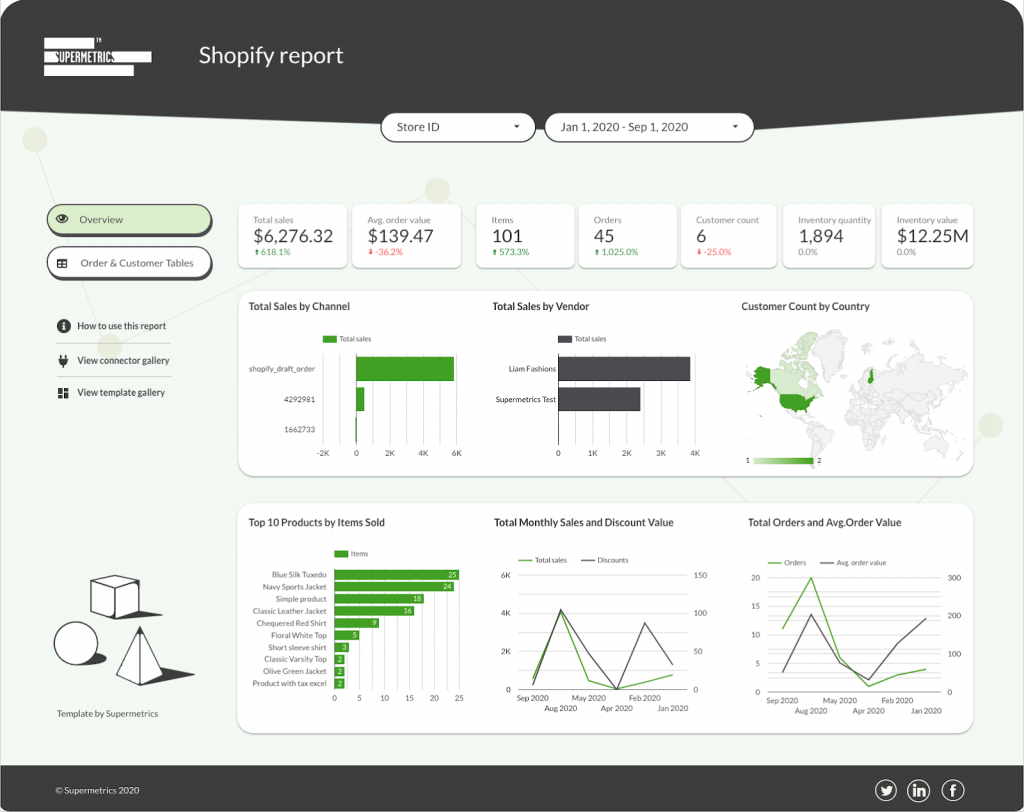
The first page shows your key metrics and their performance compared to the previous time period. Here you’ll see your best-performing products, total sales by channel and customer profile, as well as inventory quantity among other things.
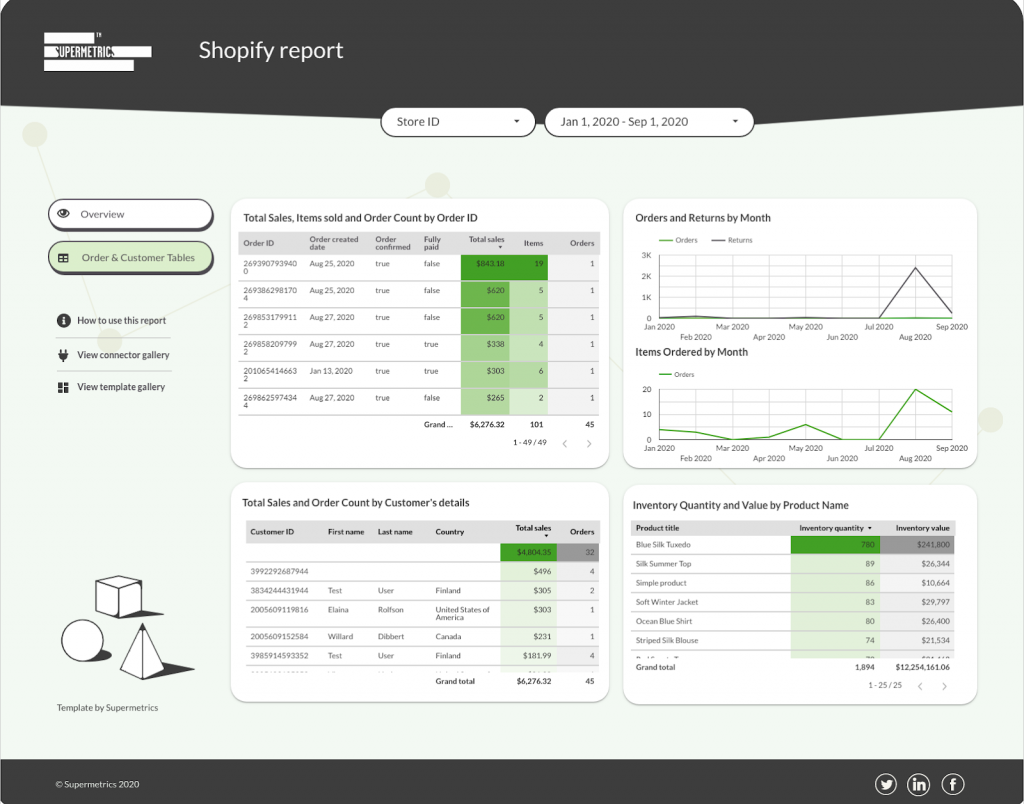
The second page provides more detailed information on orders, customer details, product inventory, inventory turnover ratio, and cancellations over time.
The best part? This template is easy to customize, so you can add, remove, or change the elements in any way you want!
To get this dashboard, simply select “Use report template for new reports” when you’re connecting Shopify to Data Studio with Supermetrics.
Over to you ?
By now, we hope that your mind is swarming with ideas of reports you can build with the new Shopify connector!
And if you’re not using Supermetrics just yet, you can start your free 14-day trial today. After the trial expires, the Shopify connector will be available as part of our Pro plans.
Turn your marketing data into opportunity
We streamline your marketing data so you can focus on the insights.