May 13, 2019
5 types of PPC reports you can create with Supermetrics [including templates]
By Supermetrics
[ Updated Feb 2, 2023 ]
10-MINUTE READ · By Anna Shutko
Over 500,000 marketers trust Supermetrics for their marketing & PPC reporting. Why? It connects to 60+ marketing platforms, has all the features to get the exact data you want, and the entire reporting process can be easily automated.
With Supermetrics it is possible to fetch data from the popular data sources such as Google Ads, Facebook Ads, and LinkedIn Ads as well as more niche ones, like AdRoll. You can use the connectors as a bundle or separately to get the insights you need, compare the performance of campaigns within each channel, and also compare the performance of campaigns across multiple channels.
In this post we’re sharing five of the most popular ways PPC marketers use Supermetrics for analyzing and reporting performance. They are:
- How to create a cross-channel PPC report
- How to create a budget tracking report for PPC campaigns
- How to perform a long-term trend analysis
- How to create a reporting dashboard for clients and managers
- How to analyze Facebook Ads data to answer specific questions
A huge thank-you goes to Jon Quinton from Overdrive Digital, who shared his own experiences and provided a great deal of insight for this blogpost.
How to create a cross-channel PPC report
One of the most important things in PPC marketing is to compare how an ad campaign is performing across different channels. With Supermetrics, you can use multiple connectors to get your campaign’s data from all your paid platforms, including search and social (e.g. Facebook Ads, Google Ads) and analytics platform’s data (e.g. Google Analytics) into a spreadsheet (e.g. Google Sheets or Microsoft Excel) to see the full picture of how traffic from paid sources has converted on your site.
Supermetrics Detailed Paid Channel Mix Reporting Template for Google Sheets
Another common use case is when the clients want to compare the attribution on Facebook Ads vs. Google Analytics. As the two platforms have different attribution systems, which do not exchange information about the cross-device conversions, tracking the numbers is crucial. This frequent monitoring allows you to improve the reporting quality and see what percentage of the traffic has come from Facebook.
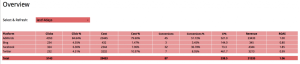
One more important report you can easily create with Supermetrics is a comparison table with the statistics from each advertising platform. In order for your campaigns to be successful, you need to convey the message on a variety of different channels, as focusing solely on one channel limits your audience reach and as a result, clicks and purchases.
You can pull together a Paid Channel Mix report which would combine data from e.g. Facebook Ads, Twitter Ads, Google Ads and other paid platforms. This report is very useful in a situation when you are communicating the same message across different channels. This way, you can easily see which platform has a higher ROI for your campaign and distribute your budget accordingly.
Combining the ad platforms’ data with the statistics from Google Analytics will provide you with an even fuller picture of how your campaigns convert.
How to create a budget tracking report for PPC campaigns
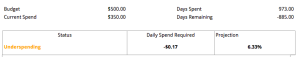
When you’re running campaigns on a regular basis it is important to track and project your spend, especially if you are doing a client project. The budget tracking report will allow you to see which campaigns are performing well in terms of budgets and which ones are under-performing or over-performing.
![]()
Supermetrics Google Ads Client Budget Tracker and Alert Reporting Template for Google Sheets
Use Supermetrics to pull your ads’ daily spend numbers. With the help of formulas you can set up the calculation of the days left in a month. Next, calculate the run rate and what you need to spend each day to hit the spend level that you are aiming for. After you are done building the dashboard set it to refresh, so every morning when you come into the office you know what you are spending and how you should adjust.
Another good reason to create a budget tracking tool is when you are running ads on a number of platforms with different currencies. For example, you are given budget in dollars, you work on an ad platform in euros and you also have a third platform which uses japanese yen. In this case, tracking what you are actually spending becomes more complicated and you lose a lot of time calculating the spend from different platforms manually.
Budget tracker helps keep track of the spend and convert the numbers into the needed currency to see how much you are spending compared to the originally allocated budget. This dashboard will provide a good overview so you can make data-driven decisions quickly.
The easiest way to understand how you can set up a tracking budget with Supermetrics is to try our Budget Tracker and Alert reporting template for Google Ads. The template is used with our Google Sheets add-on and you can easily tweak it according to your needs (for example adding a currency conversion or using it for another data source).
How to perform a long-term trend analysis
In addition to everyday check-ups on your key metrics, Supermetrics is very useful for spotting bigger trends. For example, if you want to see the “big picture” you can look at changes in metrics over 3-6 month period.
For example, your company moves to a new market and starts launching campaigns to target the audiences there. As the move itself is big, with greater costs involved, you might want to measure the overall effect of your marketing efforts after 6 months or one year.
Another good reason to conduct a trend analysis is when your company is revisioning the digital marketing strategy and fundamental changes in the campaign or account structure happen.
Finally, you want to see whether there are any major shifts in traffic behavior after a new algorithm update or even more high-level changes in search behavior. In this situation, it is good to proactively adapt to the changes, which will help you stay ahead of your competition.
Pulling the needed data into spreadsheets helps you avoid spending time looking for it in a platform’s UI.
“The less time we can spend collecting information and data the better because then it frees up more time we can spend looking at it and making decisions from it” – Jon Quinton, Founder and Digital Marketing Consultant, Overdrive Digital
A long-term view on such metrics as cost-per-lead and cost-per-sale is crucial for diagnosis as it allows to spot certain patterns and prevent problems from happening in the first place.
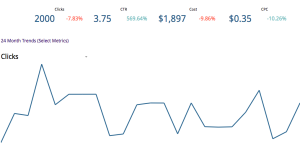
Pro tip: Use Supermetrics free plug-and-play In-depth PPC Report Reporting Template to get an insight into how the key metrics of your Google Ads account are performing over time.
How to create a reporting dashboard for clients and managers
Supermetrics’ connectors are extremely useful for getting data directly into Google Data Studio. You can easily build client-facing monthly reports which will not only be user-friendly and visually pleasing, but will also have all the data you need.
In order to build an easy-to-use and insightful overview report you first have to identify which metrics are the most important ones for your client’s campaigns. Then, highlight the key metrics together with their trends and breakdowns to provide context behind the numbers.
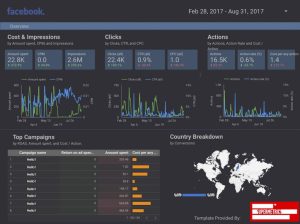
Supermetrics Facebook Ads Performance Overview Template for Google Data Studio
If you want to create reports which tell a story with data, leverage the 7 laws of UX to create dashboards which are both insightful and stylish.
How to improve the performance of your Facebooks Ads campaigns
Facebook Ads is one of the to-go platforms when it comes to paid social promotion. It has evolved into a full ecosystem which combines multiple services together. Below I will cover some scenarios of how you can analyze Facebook Ads data with Supermetrics.
Sometimes it is quite difficult to get a good overview of a specific account area by looking at a single particular report at a time. Pull all the needed data into one spreadsheet with Supermetrics and you can get a fuller picture and spot patterns easier.
Another important analysis you should conduct is a detailed campaign analysis. It often happens so that a campaign starts performing badly or even suddenly stops running and you need to quickly figure out what happened to get back on track. Poor campaign performance can happen due to a number of different reasons ranging from audience fatigue to incorrect budget setup. If you are regularly tracking changes in all the relevant metrics, such as frequency, CTR and costs over time you can easily see the factors affecting your campaign and come up with a fix faster.
Campaign performance tracking is even more important if you are running a seasonal or viral campaign (during e.g. Black Friday). As the competitive environment is more aggressive and more and more bidders are trying to take the same advertising space, tracking CPM and budget becomes crucial.
Seeing the correlation in changes of different metrics will help you identify whether there are specific patterns according to which your account behaves. For example, you can track such metrics as CTR and see whether there is an immediate effect on CPA change.
A frequent check on Facebook metrics is especially useful in a crisis situation. For example, it sometimes happens so that a part of Facebook or the whole site is not working properly. What kind of impact did it have on your ads? Do you see an immediate dramatic drop in impressions and cost metrics going up? Or does it affect your business after some time has passed? These are important questions and you cannot answer them without being able to pull all the needed metrics into a single dashboard fast.
Conclusion: how can you use Supermetrics in your analysis & optimization process?
Supermetrics is a very handy tool when you have to perform various kinds of analyses and build different PPC reports. With the help of data pulled using Supermetrics you can make informed decisions quickly, answer ad-hoc questions, and immediately see what exactly you need to do in each specific situation: is it about adjusting the budget for a particular campaign or even shutting it down altogether?
Another way of using Supermetrics is to pull together multiple bits and pieces of data to make strategic decisions. When you have a single report which shows how your campaigns and website performance are affecting your ROI you can pinpoint the areas for improvement and decide whether or not you need to change direction.
With Supermetrics, your PPC reporting becomes more reliable, effective and data-driven. Start your free 14-day trial of Supermetrics today!
Turn your marketing data into opportunity
We streamline your marketing data so you can focus on the insights.