Mar 26, 2024
Data blending in marketing: What it is, how it works, and why you need it
8-MINUTE READ | By Courtney Waganer
[ Updated Mar 26, 2024 ]
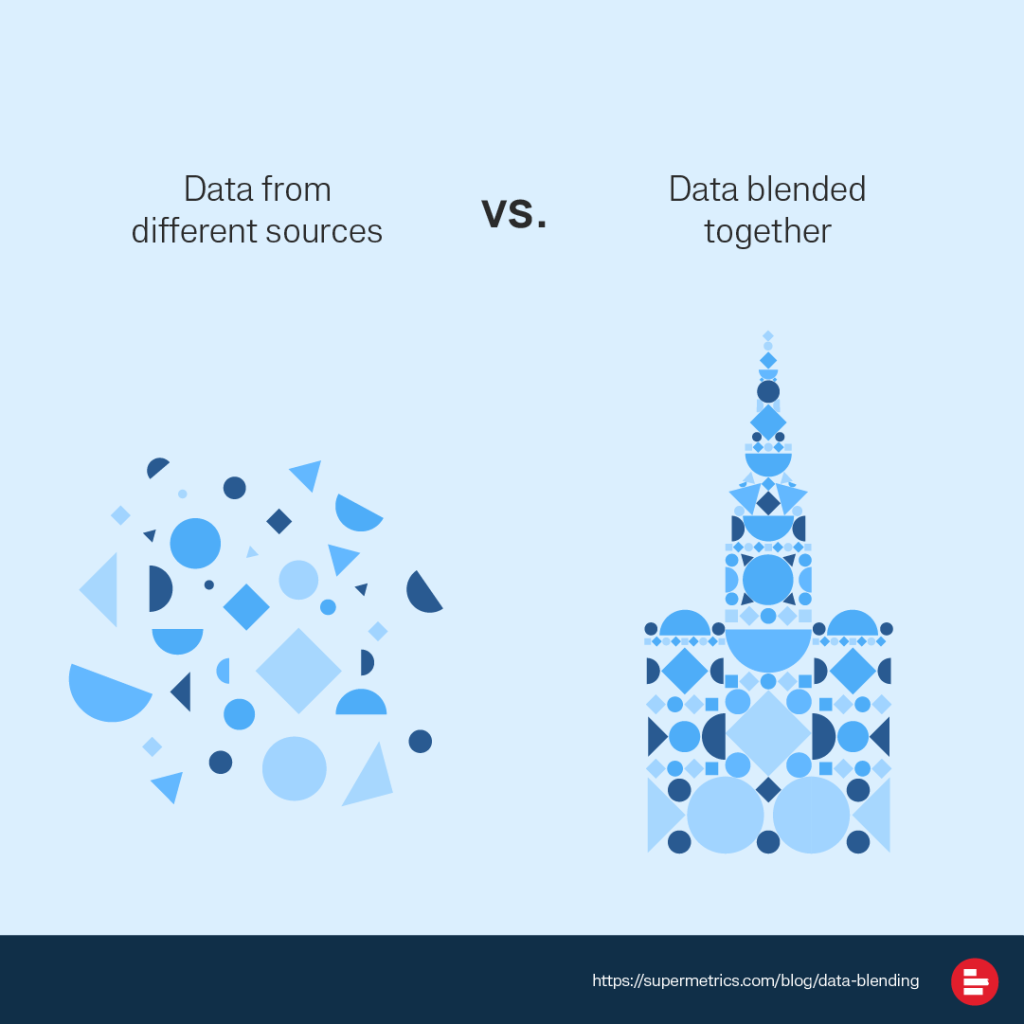
Marketers often run campaigns across several channels, and without bringing data from these sources together, you’re missing out on the full picture. That’s where data blending comes in handy.
Before you say, “Data blending is a data analyst’s thing,” I’d say it’s not entirely true at all. There are many tools that can help you with the groundwork. Once you get the core principles of data blending, you can totally do it yourself. In this article, I’ll discuss:
- What can you do with data blending
- Two ways to blend data—UNION vs. JOIN
- How to blend data
- Tools for data blending
What can you do with data blending?
Data blending is a great way to take siloed data and put them together so you’ll see the entire picture of what’s happening to your marketing.
Imagine you’re building a puzzle, but instead of one box containing all the pieces, you have mixed pieces from several puzzles — each representing a different data set. Your task is to select the correct pieces from each set to complete a single, coherent picture. Data blending is like sorting through those puzzle pieces to find the ones that fit together perfectly.
Your goal is to create a complete picture that provides a comprehensive view of the situation or problem you’re analyzing.
Let’s look at some examples of data blending in marketing.
Combine your website data with paid data to identify the best-performing campaign
Paid media platforms have a lot of nuances. For example, some channels are better for driving traffic. Others are good for generating engagements. Combining paid data with website data lets you determine what channels work best for what scenarios. You’ll be able to understand:
- The overall performance across all paid channels
- Which campaigns and channels bring in the most traffic, conversions, or engagements
- What regions bring in the most conversions
Monitoring organic social media performance
Like paid ads, you’re likely to run social media activities across different channels, such as TikTok, Instagram, and LinkedIn. You need to combine data from these sources for social media analytics. By doing so, you may notice that you’re not getting as much traction from Facebook as expected. In that case, you can decide whether to drop Facebook and invest your resources in other channels that work for you, like Instagram or LinkedIn.
Budget pacing
Budget pacing or ad spend tracking is one of the most important tasks of a performance marketer. By blending spend data from different channels, you’ll be able to build a budget pacing report, calculate your projected spend and pace, and stay within budget.
Look for optimization opportunities by combining Google Ads and Google Search Console data
By blending Google Ads and Google Search Console data, you can identify keyword opportunities for both organic and paid search visibility. You may discover keywords driving significant clicks and conversions through paid ads but with no organic rankings. This can be a sign that you need to focus on optimizing your organic visibility with these keywords. Similarly, if you find keywords that give you high-quality traffic and conversions in organic search, you should consider targeting them in your paid search campaigns.
Also, including quality score data from Google Ads can be helpful. With this data, you can help performance marketers optimize quality scores and thus get better results with a smaller budget from search advertising.
To learn more about using Google Ads data for SEO, check our article on organic vs. paid search, including a template combining data from these sources.
Two ways to blend data—JOIN and UNION
Essentially, there are two data blending techniques—UNION vs. JOIN. The main difference is how your data is combined.
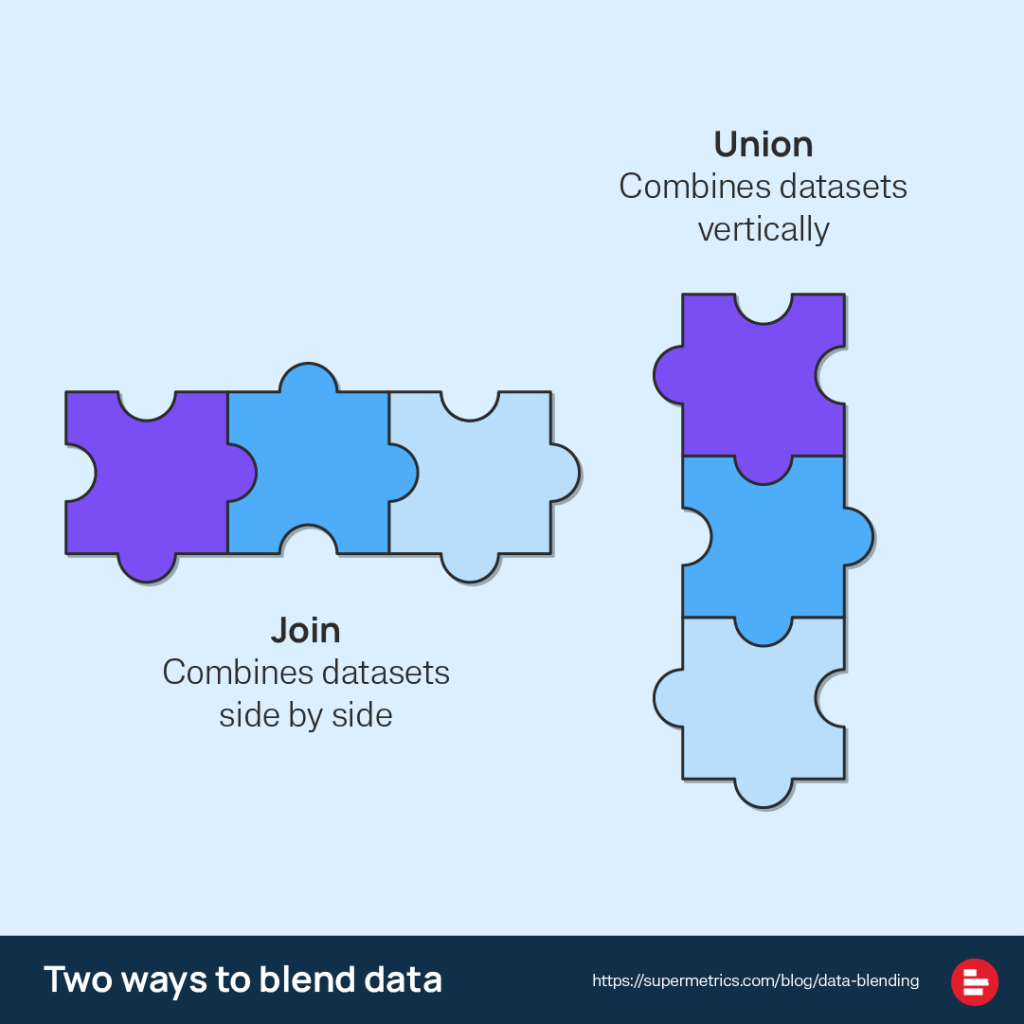
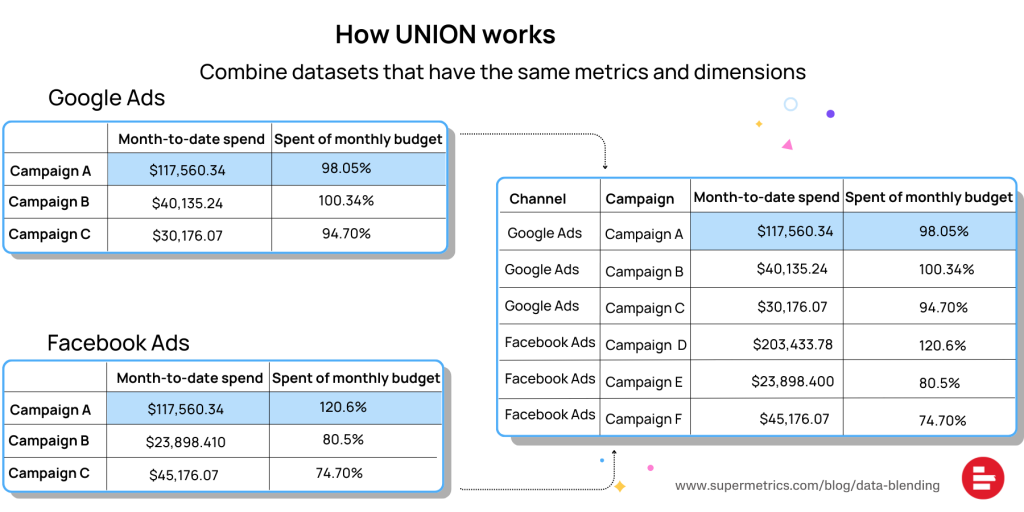
UNION
UNION is used when datasets have similar metrics and dimensions. The data tables are stacked on top of each other. It’s ideal for analyzing data from similar platforms. For example, for budget pacing, you’ll pull in the spend data from advertising platforms—they usually have similar metrics and dimensions—like Google Ads and Facebook Ads to see how your campaigns are pacing against an expected budget.
JOIN
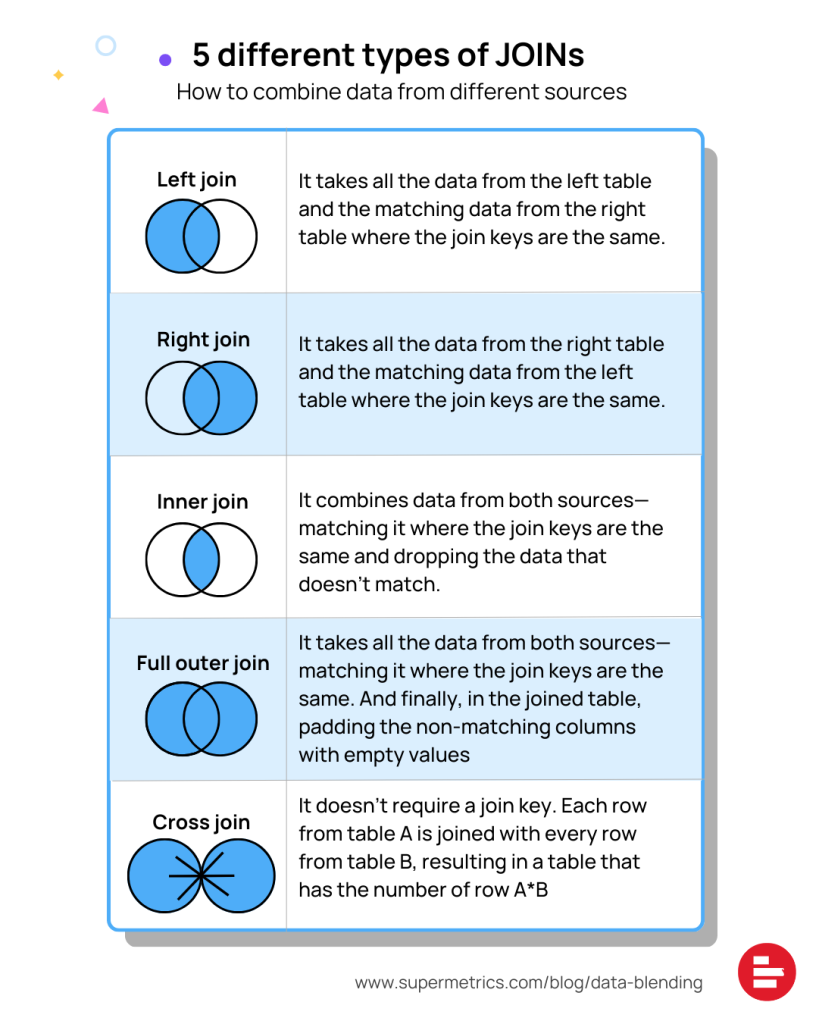
JOIN is the process of combining datasets side-by-side. Typically, your datasets have to have at least one common field or a join key. You can use JOIN to combine data from different platforms. For example, blend website and CRM data. There are five ways to join data, and your results will look different depending on the type of joins you use.
How to blend data
Step 1: Figure out what you’re trying to achieve
The tricky part about data blending isn’t just the technique — it’s about asking the right questions to ensure the results solve your problems. As a marketer, you may want to know how your marketing performs. That’s a valid question, but it could be more refined. To solve it with data, you need to break it down:
- Are you interested in performance by device and country?
- Do you want to see individual campaign performance?
- What timeline do you want to look at your performance?
- Is weekly or daily enough?
- What actions will you take after getting the insights? What can you actually influence?
Step 2: Figure out the relationship between your data
Understanding how your datasets relate to each other helps you avoid creating misleading results and choose appropriate blend logic. You can ask questions such as:
- What is the key information of each dataset? For example, customer details, product name, date, etc.
- Do the datasets share any common fields?
- What is the level of detail in each dataset? For example, daily, monthly, or campaign-level, etc.
- Do you need to clean the dataset? For example, standardize the naming conventions or date formats.
For example, if your datasets contain the same metrics and dimensions, such as social media data, then you can use UNION to blend your data. On the other hand, if you’re merging data from social media and website data, JOIN is a better choice — in this case, you’ll need to define a join key.
Step 3: Perform the blend
You can use several tools to perform the blend, including spreadsheets, BI tools, data warehouse, and the Supermetrics Marketing Intelligence Cloud. In a spreadsheet tool like Google Sheets, you can use different functions to blend data, including VLOOKUP, conditional aggregation, and IF + REGEXPMATCH. Looker Studio and the Supermetrics Intelligence Cloud have a click-and-drop interface, which makes it easier to establish and configure the blend. Meanwhile, you can blend in a data warehouse if you’re comfortable with SQL.
Here, it’s important to make sure your data follows the same structure, format, and naming convention. This will ensure that you don’t miss or duplicate any data.
Step 4: Convert blends to visuals
It is optional to convert final results from blends to visualizations, but it enhances your interpretation of the data and makes it easier to present to other team members.
Tools for data blending
Depending on your skills, you can select a tool that works best. Some common options for data blending are:
- Spreadsheets
- BI tools
- The Supermetrics Marketing Intelligence Cloud
- Data warehouse
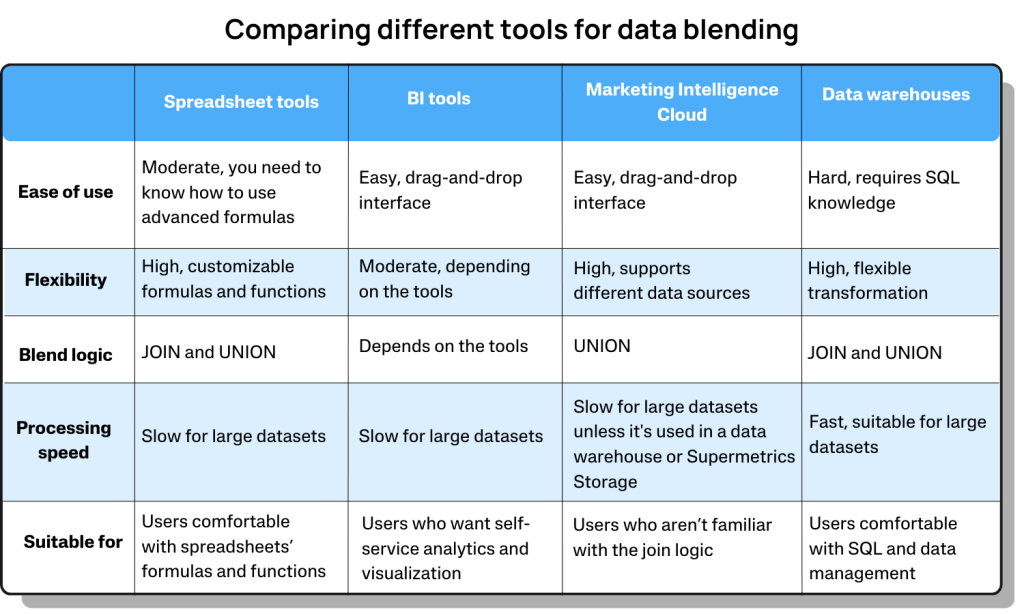
Spreadsheet tools
With a spreadsheet tool like Google Sheets and Excel, you can use different formulas to blend data from different sources. They’re free, and you have better control over what’s happening with your data. However, since there’s a 10,000-row limitation, they aren’t ideal for larger datasets. Additionally, if you’re unfamiliar with advanced formulas, it can be a hassle to do data manipulation and troubleshooting.
Spreadsheet blends are only available in the report you build, and if you want to reuse the blended data, you need to replicate the whole process again.
Business intelligence tools
Common BI tools like Looker Studio, Power BI, and Tableau offer user-friendly and click-and-drop interfaces for data blending. Completing joins directly in a BI tool makes it easy to get visualizations instead of loading the data into a dashboard after completing a blend.
The functionality can vary depending on the specific BI tool you choose. For example, despite the straightforward UI, Looker Studio (Data Studio) has some data blending limitations, including:
- You can only blend 5 data sources
- No control over what’s happening to your data under the hood
- Slow processing and loading speeds if the dataset is large
- Only support JOIN
The Supermetrics Marketing Intelligence Cloud
The Supermetrics Marketing Intelligence Cloud provides a user-friendly UI and scalable way for data blending. It’s great for marketers who aren’t familiar with the join logic. With Supermetrics, you can:
- Blend more than 150 data sources—including paid, social media, web analytics, etc.
- Review your blended fields so you can verify how they look before using them in your report
- Modify the blended sources and configure the field mapping to fit your needs
- Use the created blends in all your reporting tools
Additional resources: Learn 7 ways to transform your data using Supermetrics.
Data warehouses
A marketing data warehouse is a great place for storing data from multiple sources. It gives you more flexibility to store, manage, and transform your data. Data blending in a data warehouse requires coding knowledge. It works by using SQL to take data from the stored tables and views and blend it together. Once the blend is added as a table or view, you can visualize it in a BI tool.
Using a data warehouse keeps all of the data in one place, and because the data is stored, it helps increase the load time in dashboards.
Best practices for data blending
Understand the difference between JOIN and UNION
The difference between JOIN and UNION and how they work is important. Not understanding the differences could lead to unexpected or incomplete results. Remember, UNION is best when comparing results to similar platforms, while JOIN is best when there is a join key between any platforms.
Maintain consistency across data sources
If you don’t align metrics and dimensions before performing a blend, you could get incomplete results at best and misleading conclusions at worst. This happens the most often when people try to join on dimensions with different naming conventions across platforms or try to add an extra metric for a platform when performing a union. Having a marketing data governance in place could help.
The level of granularity matters
Make sure you’re keeping the same level of granularity across your datasets. For example, you can’t have ad-level data for Facebook but campaign-level for Snapchat. This is because a union requires the same number of columns, and having ad-level data will increase the number of times a campaign is listed, leading to duplicates in the data.
Over to you
Many marketers feel scared or shy away from doing data blending because of its technical aspects. Luckily, many platforms can handle the intimidating work, so you don’t have to worry about putting the actual blend together. All you need to know are what kinds of results you’re looking for and the characteristics of your datasets.
You can play around with small datasets, and once you get the hang of it, you can try blending data from more sources. Once you incorporate data blending into your process, you’ll discover interesting and meaningful insights from your data.
About the author

Courtney Waganer
Courtney brings her 6 years of analytics experience, the last 2 focused on marketing analytics, to help businesses leverage data for smarter decisions. Previously, she tackled siloed data challenges at a marketing agency, streamlining reporting processes. Now at Supermetrics, she assists clients in unifying marketing data for a comprehensive view. Her technical skills include using SQL and DBT for data manipulation and creating insightful Looker Studio dashboards. Courtney's expertise extends beyond the technical. She co-hosted webinars on marketing analytics topics, solidifying her understanding of the field and her commitment to delivering actionable insights to clients.
Turn your marketing data into opportunity
We streamline your marketing data so you can focus on the insights.